CSL780: Computer Vision - Image Histograms
-
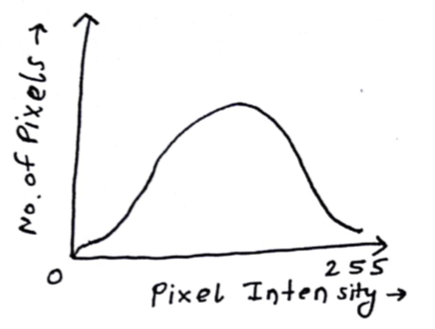
The main discussion went on Image Histograms. An Image histogram describes the frequency of intensity values that occur in an image. It is a plot where x-axis denotes the pixel intensity and the y-axis is for the number of pixels with a given intensity.
-
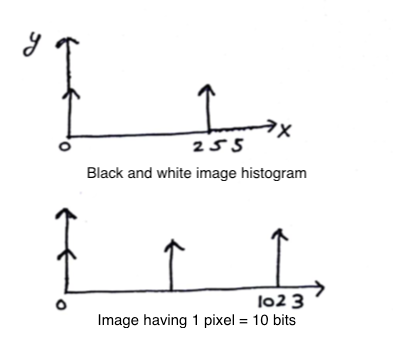
Newspaper images are actually not grayscale even though they appear. They are actually black and white(only two pixel values possible, 0 and 1) and appear grayscale (pixel values from 0 to 255) due to Digital Halftoning.
Image Histograms
- We are studying histograms but why? They can be used to identify some problems that may originate during image acquisition like exposure and contrast.
-
Just by looking at histogram, we can say whether the image is bright or dark.
-
The histograms for black & white image and an image with 10-bit pixel can look like:
-
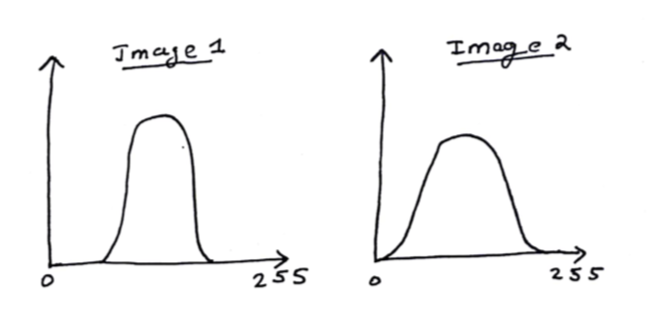
Out of two given image histograms, how can we say which image is better? The notion of better is defined in terms of visibility. An image using more pixel values would have higher contrast and would be better.
- A funny question, a camera above hand captures the image and if the hand is shifted slightly left/right, will the new image have a different histogram?
- It can be said that it will be exactly the same.
- Another question came up, why do we only use 8 bits for pixels?
- Because, mostly hardwares are designed in a way to process them faster.
Negation of an image
Considering output pixels on y-axis, and input pixels on x-axis, the negation simply performs the following operation:
This operation can be used in medical imaging. It takes a black image with white background and can convert it to a white image with black background and vice-versa.
Few transformations
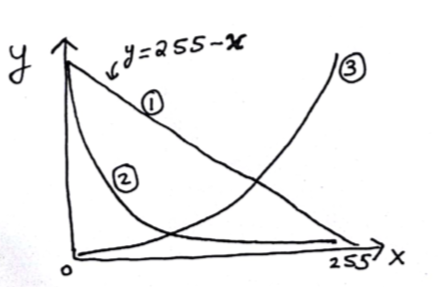
Out of the given three transformations, 2nd one suppresses the white pixels. The 3rd one makes the dark pixels more dark and bright ones even brighter. Thus, improving contrast. A possible equation could be:
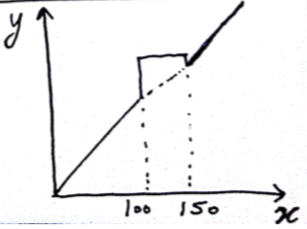
The above transformation is referred as slicing and is useful in medical imaging as it can highlight the object of interest as here the pixel values between 100 and 150 are highlighted.
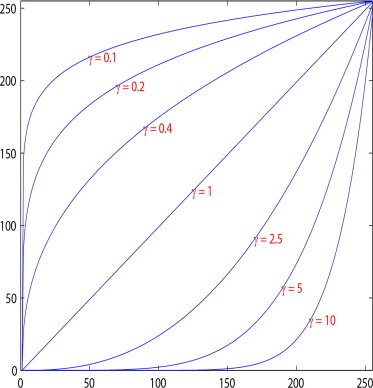
Gamma Correction
Each pixel in an image has brightness level, called luminance. Different camera or video recorder devices do not correctly capture luminance. Different display devices do not display luminance correctly neither. So, one needs to correct them, therefore the gamma correction function. The following function is used:
The curves below performs gamma correction, whereas those above perform inverse gamma correction.
Edge detection
- The human eyes are most sensitive towards edges in an image. Then, the smooth portions and then finally texture.
| 10 | 9 | 10 |
| 9 | 10 | 10 |
| 10 | 8 | 9 |
- The above shown 3x3 pixels represent a smooth portion as the pixel values are quite close to one another.
- The variance and contrast in smooth portion is low whereas variance is very high for texture.
- For edge detection, convolution with a mask/filter is required.
| 9 | 8 | 7 |
| 20 | 21 | 22 |
| 5 | 6 | 7 |
-
The above shown 3x3 part of image has a horizontal edge. The easy trick to remember is :
Vertical gradient => Horizontal edge
Horizontal gradient => Vertical edge -
The below 3x3 mask can perofrm smoothing/averaging and reduces contrast.
| 1/9 | 1/9 | 1/9 |
| 1/9 | 1/9 | 1/9 |
| 1/9 | 1/9 | 1/9 |
- What if we increase the window size for the mask from 3x3 to higher values?
- This would lead to more and more smoothing as the values obtained after convolution would be closer to each other.